|
Russian Gas Insight 2006-1 is
in PDF format and contains 150 pages.
Updated tables showing our latest
projections are sold separately.
Click here for the
PowerPoint presentation of RGI 2006.
TABLE OF CONTENTS
FOREWORD
EXECUTIVE SUMMARY
Key Indicators
Summary
Gas Business Environment
Demand and Supply Balance
Cost Performance of Gazprom
PART 1. RUSSIAN GAS BUSINESS ENVIRONMENT
1.1. Key Findings and Conclusions
1.2. Service area of Gazprom in Russia and the FSU
1.3. Cost of Russian labor, materials and supplies
1.4. Russian gas price and transit tariff development
1.5. Export price of Russian gas in Europe and the FSU
1.6. Taxation in the gas sector of Russia
1.7. Business prospects for independent gas producers
PART 2. GAS BALANCE AND VOLUMETRIC ANALYSIS
2.1. Key findings and conclusions
2.2. Historic and projected gas sales
2.2.1. Sales in the service area of Gazprom in Russia by
region and consumer sector
2.2.2. Exports to the FSU by country
2.2.3. European exports by country and export terminal
2.3. Gas supply: Production and import
2.3.1. Supply and demand balance
2.3.2. Gazprom production by major field and producing
company
2.3.3. Independent producers and oil companies
2.3.4. Import and transit from Central Asia
2.4. Gas flows, transmission capacity, bottlenecks and storage performance
2.4.1. Historic and projected cross-regional flows
2.4.2.
Spare capacity and capacity deficit by year
2.4.3.
Base Case: Order of completion of new major pipelines
2.4.4. Historic and projected storage injection and
withdrawal
PART 3. COST AND BENEFIT ANALYSIS
3.1. Key findings and conclusions
3.2. Production costs of Gazprom
3.2.1. Historic and projected production costs by reservoir
category
3.2.2. Production investment projections by major field and
reservoir category
3.3. Transmission costs of Gazprom
3.3.1. Historic and projected transmission costs
3.3.2. Pipeline investment requirements
3.4. Cost of transit out of Russia
3.5. Cost of sales and cost of gas delivered to different markets
3.6. Gazprom profit by market segment and net cash flow from gas operations
3.6.1. Profit by market segment
3.6.2.
Net cash flow from gas operations
PART 4. COMMENTS TO FINANCIAL REPORTS OF
GAZPROM
4.1. Key findings and conclusions
4.2. Sample discrepancies of quarterly reports
4.3. Tax overpayment of Gazprom
4.4. Other observations
PART 5. RGI FOCUS: RUSSIAN-UKRAINIAN GAS
DISPUTE
5.1. Key findings and conclusions
5.2. History of gas transit relations
5.2.1. From Itera to Eural Trans Gas and RosUkrEnergo
5.2.2. Contradicting statements of Russia’s and Gazprom
officials
5.3. Economics of gas transit
LIST OF TABLES
Table 0-1: Major Advantage and Disadvantage of
Gazprom
Table 1-1: Administrative Regions of Gazprom’s
Service Area in Russia
Table 1-2: Russian Gas Price Net of VAT, as of December 31, 2005
Table 1-3: Historic and Projected Rates of Annual Growth of Domestic Price of
Gas
Table 1-4: Average Price of Gas in Russia in 2000-2025, USD/mcm
Table 1-5: Russian Gas Transit Tariffs, as of July 31 and October 1, 2005
Table 1-6: Gazprom Export Price Assumptions for 2000-2025, USD/mcm
Table 1-7: Gas Industry Taxation in 2004 and 2005
Table 2-1: Gas Deliveries to Russian Consumers via
Gazprom Pipelines in 1997-2005, bcmy
Table 2-2: Historic and Assumed Annual Growth Rates by Consumer Sector of
Russia, percent
Table 2-3: Gas Deliveries to Russian Consumers via Gazprom Pipelines in
2000-2025, bcmy
Table 2-4: Russian Deliveries via Gazprom Pipelines by Source of Supply, bcm
Table 2-5: Ukrainian Gas Consumption Breakdown for 1990-2005, bcm
Table 2-6: Gazprom’s Exports to FSU in 2000-2025 – Base Case, bcm
Table 2-7: FSU Exports in 2000-2025 by Source of Supply, bcm
Table 2-8: FSU Exports in 2000-2025 by Country and Region, bcm
Table 2-9: European Exports in 1997-2005 by Country, bcm
Table 2-10: European Exports in 1997-2004 by Terminal, bcm
Table 2-11: Exports to Western & Eastern Europe, bcm
Table 2-12: European Exports in 2000-2025 by Source of Supply, bcm
Table 2-13: European Export Projections by Country, bcm
Table 2-14: Base Case Export Projections by Terminal, bcm
Table 2-15: Gazprom’s Gas Balance for 1997-2004, bcm
Table 2-16: Gas Balance of Gazprom for 2000-2025, bcm
Table 2-17: Gas Deliveries in 2000-2025 by Source of Supply, bcm
Table 2-18: Gazprom Production Forecast by Field, bcm
Table 2-19: Historic Gazprom Production by Cost Category, bcm
Table 2-20: Gazprom Production Forecast by Cost Category, bcm
Table 2-21: Historic Net Gas Production of Gazprom by Region, bcm
Table 2-22: Gazprom’s Net Production Forecast by Region, bcm
Table 2-23: Net Gas Production of Independents and Oil Companies in 2000-25,
bcm
Table 2-24: Forecast of Independent Gas Input by Region, bcm
Table 2-25: Gas Imports from Central Asia in 1997-2005, bcm
Table 2-26: Base Case Projections of Central Asian Imports, bcm
Table 2-27: Central Asian Gas Flow Breakdown by Destination, bcm
Table 2-28: Annual Cross-Regional Flows in 1997-2005, bcm
Table 2-29: Projection of Annual Cross-Regional Flows, bcm
Table 2-30: Projection of Maximum Daily Flows, mmcmd
Table 2-31: Capacity Deficit after Upgrade of Existing Pipelines, bcmy
Table 2-32: Capacity Upgrade along the Major Pipeline Routes, bcmy
Table 2-33: Construction Schedule of Major Pipeline Projects, km
Table 2-34: Projected Storage Injection and Withdrawal by Region, bcm
Table 2-35: Ukrainian Storage Injection and Withdrawal, bcm
Table 3-1: Production Cost of Cenomanian-1
(Yamburg type), $/mcm
Table 3-2: Production Cost of Cenomanian-2 (Zapolyarnoe type), $/mcm
Table 3-3: Production Cost of High Sulfur Reserves, $/mcm
Table 3-4: Production Cost of Deep & Small Reserves, $/mcm
Table 3-5: Average Production Cost of Gazprom, $/mcm
Table 3-6: Production Cost Projection for Cenomanian-1, Cenomanian-2 and
Cenomanian-3 Reserves, $/mcm
Table 3-7: Production Cost Projection for Deep & Small, High Sulfur Reserves and
Gazprom Average, $/mcm
Table 3-8: Itera’s Investment into Development of Cenomanian Reservoirs
Table 3-9: Investment Cost per 1 MW of Booster Station Capacity and per 1 bcmy
of Production
Table 3-10: Total Investment Cost by Reservoir Category, $ billion
Table 3-11: Average Transmission Cost in 1997-2005, $/mcm
Table 3-12: Average Transmission Cost Projection for 2005-2025, $/mcm
Table 3-13: Steel Pipe Requirements of Gazprom under Base Case, km
Table 3-14: Projected Transit Tariffs the FSU and Eastern Europe, USD/mcm per
100 km
Table 3-15: Average Cost of Gas Delivered to Russia, $/mcm
Table 3-16: Cost of Gas Delivered to Belarus, $/mcm
Table 3-17: Cost of Gas Delivered to Ukraine, $/mcm
Table 3-18: Cost of Gas Delivered to Baltic States, $/mcm
Table 3-19: Cost of Gas Delivered to Other CIS, $/mcm
Table 3-20: Cost of Gas Delivered to Europe, $/mcm
Table 3-21: Projection of Average Cost of Gas Delivered to Russian Market, $/mcm
Table 3-22: Projection of Cost of Gas Delivered to Belarus, $/mcm
Table 3-23: Projection of Cost of Gas Delivered to Ukraine, $/mcm
Table 3-24: Projection of Cost of Gas Delivered to Baltic States, $/mcm
Table 3-25: Projection of Cost of Gas Delivered to Other CIS, $/mcm
Table 3-26: Projection of Average Cost of Gas Delivered to European Market,
$/mcm
Table 3-27: Revenues and Costs of Sales to Russian Market, $ bn
Table 3-28: Revenues and Costs of Sales to Belarus, $ bn
Table 3-29: Revenues and Costs of Sales to Ukraine, $ bn
Table 3-30: Revenues and Costs of Sales to Other CIS, $ bn
Table 3-31: Revenues and Costs of Sales Baltic States, $ bn
Table 3-32: Revenues and Costs of Sales to Europe, $ bn
Table 3-33: Revenues and Costs of Sales of Transit Services, $ bn
Table 3-34: Total Revenues and Costs of Sales of Gazprom, $ bn
Table 3-35: Delivery Cost and Regional Price of Gas, as of December 2002
Table 3-36: Profitability of Gas Sales to Russia and Europe in 2005-2025
Table 3-37: Overall Profitability of Gas Operations of Gazprom
Table 3-38: Assumed Growth Rate of Cost of Labor and Materials at Gazprom
Table 4-1: Quarterly Production Expense of
Gazprom, RUR mill
Table 4-2: Quarterly Transmission Expense, RUR mill.
Table 4-3: Overpayment of Export Duty in 2004 – Ukraine
Table 4-4: Overpayment of Export Duty in 2004 – Europe
Table 4-5: Overpayment of Export Duty in 2004 – Poland
Table 5-1: Benefits from Giving Ukrainian Exports
to Itera in 1998
Table 5-2: Costs and Revenues of Gazprom under New Transit Agreement with
Ukraine
Table 5-3: Variations of New Transit Agreement with Ukraine
Table 5-4: Estimated Performance of RosUkrEnergo in 2006
Table 5-5: Performance of RosUkrEnergo in 2005
Table 5-6: Winter Daily Balance of Ukraine in 2002-2006, mmcmd
Table 5-7: Ukrainian Balance of Jan-20-2006
LIST OF FIGURES
Figure 0-1: Estimated Price of European Exports in
2003-2006
Figure 0-2: Average Price and Cost of Gas Delivered to Russian Consumer 2000-2025
Figure 0-3: Average Production Cost of Gas 2000-2025
Figure 0-4: Average Cost of Gas Delivered to Europe 2000-2025
Figure 0-5: Cost of Gas Delivered to Vyborg 2000-2025
Figure 0-6: Estimated Cost of Transit for Third Parties 2000-2025
Figure 0-7: Price of Gas in Different Markets
Figure 0-8: Production Acquisition by Gazprom in 2000-2005
Figure 0-9: Gas Delivery by Destination 2000-2025
Figure 0-10: Supply by Source – Old & New Production, Import, 2000-2025
Figure 0-11: Production Cost of Yamal and Average Gazprom 2000-2025
Figure 0-12: Production Cost Breakdown 2000-2025
Figure 0-13: Breakdown of Cost of Gas Delivered to Russia 2000-2025
Figure 0-14: Breakdown of Cost of Gas Delivered to Europe 2000-2025
Figure 0-15: Profits from Sales to Russia and Exports 2000-2025
Figure 0-16: Production and Transmission Investment of Gazprom 2000-2025
Figure 0-17: Estimated Potential for Increase of Cash Flow
Figure 0-18: Effect of Overpayment of Export Duties
Figure 0-19: Gazprom Taxes and Dividends Paid to the State
Figure 0-20: Performance of Management of Gazprom 1999-2005
Figure 1-1: Gazprom Service Area in Russia
Figure 1-2: Six Regions of Gazprom Service Area in Russia
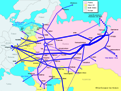
Figure 1-3: Major Gas Pipelines of Russia and the Former Soviet Union
Figure 1-4: Ruble to US Dollar Exchange Rate 1998-2005
Figure 1-5: Russian Wages in 1998-2005, USD/month
Figure 1-6: Russian Average Wage and Industrial Price Index
Figure 1-7: Gazprom and Russian Average Wage, Jan-98 = 100
Figure 1-8: Average Wage by Industrial Sector in 2004
Figure 1-9: Average Wage by Region, Jan-Apr-2005
Figure 1-10: Wage and Industrial Price Scenario 2000-2025
Figure 1-11: Gazprom Wage Projection 2000-2025
Figure 1-12: Gas Pricing Zones in Russia
Figure 1-13: Non-Residential Gas Price in Central Russia
Figure 1-14: Net and Gross Price of Gas, USD/mcm
Figure 1-15: Russian Transit Tariffs in 1997-2005
Figure 1-16: Transit Tariff Projections for 2000-2025
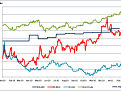
Figure 1-17: Price of European Gas Exports and Brent Crude
Figure 1-18: Price of Gas Exported to FSU, 1997-2004
Figure 2-1: Selected Sectors’ Performance in
1990-2005
Figure 2-2: Russian Fuel Sectors in 1990-2005
Figure 2-3: Power Sector & Industrial Indices, 1990-2005
Figure 2-4: Gas Share in Fuel Mix of Power Companies in 2004
Figure 2-5: Russia’s Gas Consumption in 1990-2025, bcm
Figure 2-6: Russia’s Gas Consumption Forecasts, bcm
Figure 2-7: FSU Gas Exports in 1997-2005 by Destination, bcm
Figure 2-8: FSU Exports in 1997-2005 by Source of Gas, bcm
Figure 2-9: Exports to Ukraine in 1997-2005 by Gas Source, bcm
Figure 2-10: Gazprom Exports to FSU in 2000-2025, bcm
Figure 2-11: FSU Exports in 1990-2025, bcm
Figure 2-12: Russian Deliveries and FSU Exports, 1990 = 100
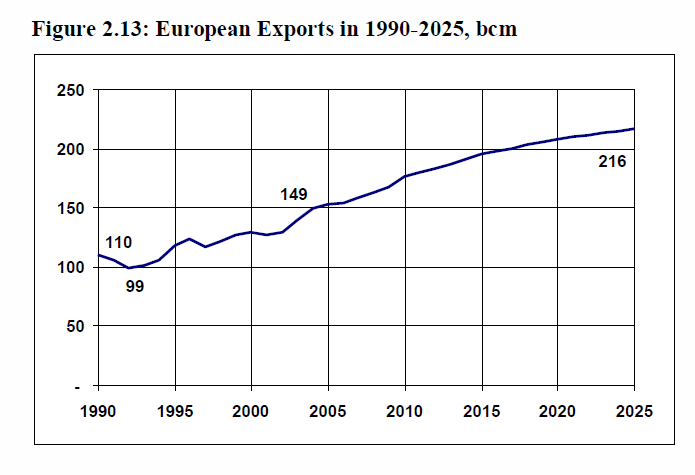
Figure 2-13: European Exports in 1990-2025, bcm
Figure 2-14: Projected European Exports by Transit Route, bcm
Figure 2-15: Old and New Production of Gazprom, bcm
Figure 2-16: Major Gas Fields of Yamal Peninsula
Figure 2-17: Gazprom Daily Production 1997-2005, mmcmd
Figure 2-18: Gazprom Daily Production in W. Siberia, mmcmd
Figure 2-19: Seasonal Swing of Urengoy and Yamburg
Figure 2-20: Seasonal Production Swing outside of W. Siberia
Figure 2-21: Daily Export Flows out of Uzhgorod
Figure 2-22: Regional Borders and Cross-Border Pipelines
Figure 2-23: Daily Export Flow out of Izmail
Figure 2-24: Seasonal Swing of Uzhgorod and Izmail Flow
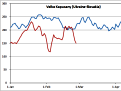
Figure 2-25: Ukrainian Daily Consumption and Exports
Figure 2-26: Daily Flow from Central Russia to Ukraine
Figure 2-27: Daily Flow from NW Russia to Ukraine
Figure 2-28: Daily Flow from Ukraine to South Russia
Figure 2-29: Breakdown of Daily Flow from Russia to Ukraine
Figure 2-30: Seasonal Swing of Gas Use in Russia
Figure 2-31: Capacity Deficit by Major New Pipeline Project - 1
Figure 2-32: Capacity Deficit by Major New Pipeline Project - 2
Figure 2-33: Capacity Deficit by Major New Pipeline Project - 3
Figure 2-34: Underground Gas Storage Facilities in Russia
Figure 3-1: Average Production Cost in 1997-2005,
$/mcm
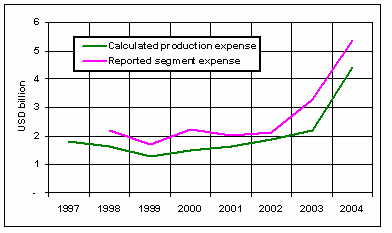
Figure 3-2: Reported and Calculated Production Expense
Figure 3-3: Production Cost Growth, 1999 = 100
Figure 3-4: Share of Taxes in Production Cost in 1997-2025
Figure 3-5: Operating Expenses of Production in 1997-2025
Figure 3-6: Time Factor in Investment Cost – Yamal & Shtokman
Figure 3-7: Production Investment by Major Fields, 2005-2025
Figure 3-8: Transmission Cost Vs Industrial Price Index
Figure 3-9: Total Transmission Expense of Gazprom in 1997-2025
Figure 3-10: Transmission Expense Breakdown in 2000-2025, $ bn
Figure 3-11: Transmission Cost and Domestic Transit Tariff
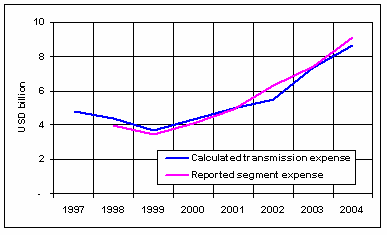
Figure 3-12: Reported and Calculated Transmission Expense
Figure 3-13: Pipeline Investment – Base Case
Figure 3-14: Pipeline Investment – “Yamal-Ukhta” Case
Figure 3-15: Cost of Gas Delivered to Uzhgorod and Kondratki
Figure 3-16: Cost of Gas Delivered to Vyborg and Blue Stream
Figure 3-17: Cost of Gas Delivered to German Border
Figure 3-18: Cost of Export Gas Delivered to Russian Border
Figure 3-19: Sensitivity of Cost of Gas at the Russian Border
Figure 3-20: Revenues and Expenses of Sales to Russia
Figure 3-21: Revenues and Expenses of Sales to Europe
Figure 3-22: Revenues and Expenses of Sales to Belarus
Figure 3-23: Revenues and Expenses of Sales to Ukraine / RUE
Figure 3-24: Revenues and Expenses of Sales to Other CIS
Figure 3-25: Revenues and Expenses of Sales to Baltic States
Figure 3-26: Revenues and Expenses of Sales of Transit Services
Figure 3-27: Total Revenues and Expenses of Gas Operations
Figure 3-28: Net Cash Flow – High Growth of Gazprom Costs
Figure 3-29: Net Cash Flow – Low Export Price
Figure 4-1: Transmission Expense and Gas Delivery
by Pipeline
Figure 4-2: Original Transmission Expense and Depreciation
Figure 4-3: Adjusted Transmission Expense and Depreciation
Figure 4-4: Production, Transmission and Fuel Gas Expense
Figure 4-5: Production Expense and Gas Production of Gazprom
Figure 4-6: Production Expense for 2004
Figure 4-7: Electricity Expense of Gazprom
Figure 4-8: Staff Costs of Gazprom
Figure 4-9: Number of Employees of Gazprom in
2003-2004
Figure 4-10: Reported Price of Gas in H1 and Q3 of 2005
Figure 5-1: Winter Temperature in Moscow, °C
Figure 5-2: Winter Temperature in Kiev, °C
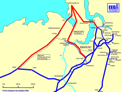
Figure 5-3: Export Pipelines and Gas Storage Facilities of Western Ukraine
Please send your inquiries to Mikhail Korchemkin
by email: korchemkin@eegas.com
|
